Want to Know What Young People are Thinking?
Here’s How to Survey Them.
Springtide Research Institute engages the power of social science to learn from and about young people ages 13 to 25. We deliver accessible research on the perspectives and experiences of emerging generations. Having administered surveys to tens of thousands of young people, our research process works to give voice to young people on your biggest questions.
Below, we share helpful tips and processes to gather organization-specific data on young people so you can serve their needs more effectively.
Why Survey Young People?
1. To learn more about young people
Generational differences are inevitable. To meaningfully serve young people, you need to know who they are and how they think. Gen Z (born between 1996 and 2009) and Gen Alpha (born in 2010 and after) have unique lived experiences that will affect your work with them.
Mirelia,16, a Springtide Ambassador, told us, “I wish the adults in my life were more curious about my experience as a modern teenager in general. I feel like a lot of adults feel like they automatically understand my experiences because they used to be a teenager.”
Better knowing how Mirelia’s experiences impact what she thinks and believes allow you to serve her and others like her better.
Here’s what Springtide data already show:
- Gen Z is the most diverse generation to date. And the experiences of Black, Indigenous, and other young people of color are often marked by racial prejudice and discrimination.
- Many members of Gen Z consider themselves at least slightly religious (68%) or at least slightly spiritual (78%), yet they’re not all tied to a particular faith tradition. Nearly 4 in 10 young people say they never attend religious services.
- Members of Gen Z report experiencing high levels of loneliness, depression, and other mental health challenges.
- The State of Religion & Young People 2022 found that nearly half of young people reported being moderately or extremely depressed (47%)
- Over half of young people say they are moderately or extremely anxious (55%) or moderately or extremely stressed (57%)
Asking the right questions helps you to have a clear understanding of youth in your community.
Your organization needs real data, not untested narratives. Compass, our survey tool kit, can help answer your biggest questions about the young people you serve.
2. Young people want you to ask them questions
“I wish the adults in my life would ask about my personal beliefs and opinions on important matters more often.” —Sunny, 17, Springtide Ambassador
“When adults take the initiative to ask about my experiences and feelings regarding my identity, it shows a level of care and empathy that can strengthen my relationships with them.” —Joelle, 22, Springtide Ambassador
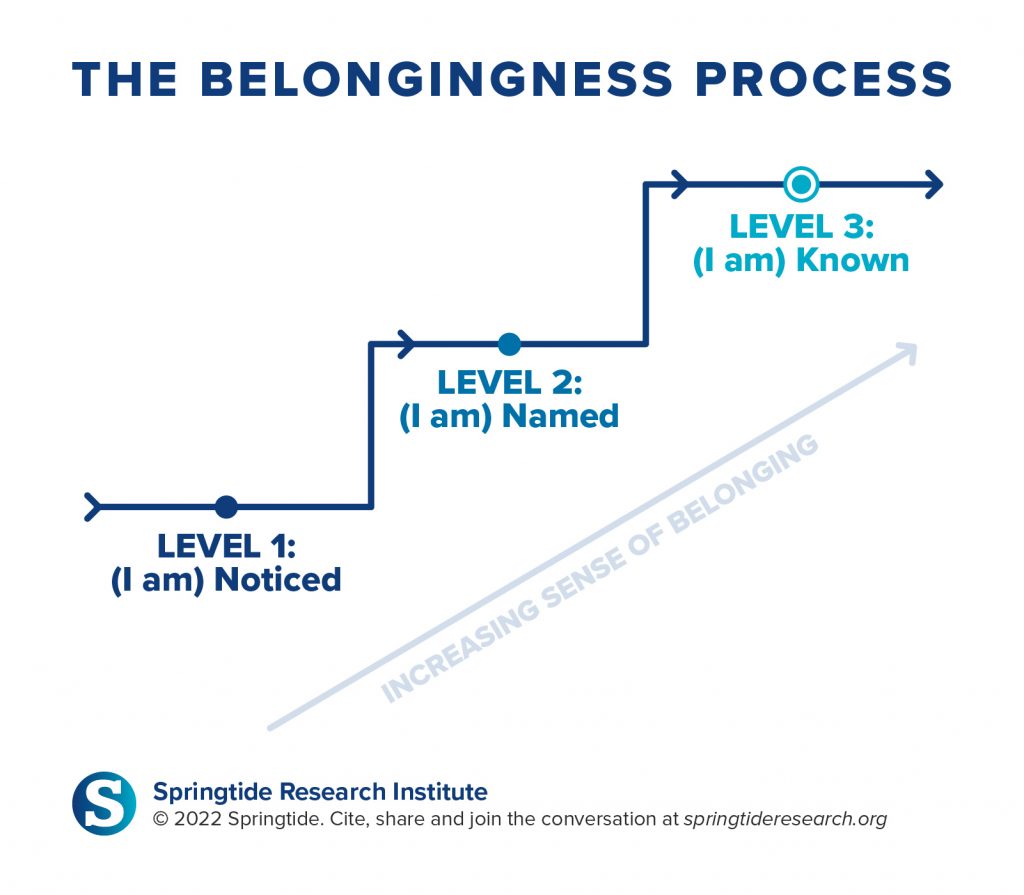
When Springtide analyzed interview data gathered for Belonging: Reconnecting America’s Loneliest Generation, we saw a clear pattern in young people’s stories as they moved from merely being part of a group to experiencing true belonging.
Over and over again, three distinct experiences showed up in their narratives: feeling noticed, feeling named, and feeling known. These experiences build on one another to deepen the overall experience of belonging. Caring enough to ask questions can be an initial step in helping young people feel known.
How to Prepare a Survey
1. Decide the best time to survey
Plan to do your survey during the time of year or season when most of the young people in your organization will be present and active. This way, you have the best chance of getting as many young people as possible to take your survey.
Although it might seem like young people’s schedules are packed during these key times, higher engagement with your organization offers more thorough touchpoints to build awareness and motivation to answer the survey.
Note: Surveys aren’t always appropriate for all types of research. If your question is along the lines of “What does this organization do that’s working?” then a survey will be useful for your goals.
However, if your question is a “How” or “Why” question such as, “Why do young people participate in this program?” This question can only be answered by a survey in a limited capacity. In this case, focus groups or interviews would provide a more useful and cost-effective solution. Springtide offers custom research options for this purpose, giving you access to expert advice and support from our team.
2. Write survey questions
Surveys typically have at least 4 different types of questions: multiple choice, “Likert” scales, open-ended questions, and demographics.
Multiple choice is like what you might see on an exam—a question with several different options to choose from. “Yes/no/maybe” questions are also considered multiple choice on social science surveys. Multiple choice is good for questions that have concrete answers like, “How often does your organization meet with students?” or, “How many students attend your organization’s programming monthly?” Multiple choice questions can also be “check all that apply,” where respondents are allowed to check more than one option. This is helpful for questions like, “What kinds of programming do you offer to students?” where respondents might offer more than one type of program.
Likert scales are a type of multiple choice question that offers a range of responses on a scale. Often ranging from “strongly disagree” to “strongly agree,” Likert scales allow survey administrators to analyze and compare responses to statements such as, “I am satisfied with the programming offered by my organization.” Likert scales can also be satisfaction measures from “very dissatisfied” to “very satisfied.” These questions are useful for measuring attitudes about specific topics, like organizational culture.
Open-ended questions are a blank text box in your survey that respondents can use to write their own answers. These are good for questions like, “What is your favorite thing about your organization?” or general feedback. It can be tempting to make every question an open-ended question, but respondents typically lose momentum if asked to write a lot in a survey, and it becomes significantly more difficult to measure or compare responses across participants. No more than 2 open-ended questions is ideal for a survey that takes less than 10 minutes to complete.
Demographic questions such as age, gender, and race are usually at the beginning or end of a survey. These questions allow social scientists to look at how larger structural and social factors might shape responses to a survey (for example, younger students might report lower levels of belonging in a school than old students). Depending on the goals of your survey, demographic questions such as region (What part of the U.S. do you live in?) or employment status may or may not be appropriate for your project. At Springtide, we recommend including age (How old are you?) on every survey, because young people’s interactions with organizations are significantly different from adults.
Ensure your survey will get the best results possible with surveys created by researchers. Springtide offers Compass, created with researcher-developed and nationally tested survey questions based on your areas of interest. Client research and consultations for specialized projects are an option with Custom Research.
3. Determine the length of your survey distribution
We often see the best results with a focused two-week push or a month-long campaign to distribute a survey. You know your community best, so plan a time frame that will maximize participation.
When you purchase a personalized survey tool kit like Springtide’s Compass, you’ll get a window of one year within which to open and close your survey.
Acting with a sense of urgency helps you get insights quickly so that you can make data-driven decisions to support young people sooner rather than later.
How to Distribute a Survey
1. Introduce the survey
Explain to the young people and their parents what the survey is, who it is intended for, and what you plan to do with the insights you gain from it.
When you promote the survey, people might ask who the survey provider is. Using Compass by Springtide Research, you will receive a pre-written description that you can use to explain who wrote the survey. If you’ve written the questions yourself, provide a few sentences that explain what your organization does, what it does for young people, and why you’re conducting this survey.
2. Offer survey incentives
Participation incentives, or rewards, are small tokens of appreciation designed to motivate young people to complete the survey. Incentives lead to higher response rates, improve the quality of the data collected, and enhance overall participant engagement. Incentives acknowledge and appreciate respondents’ time and effort, signaling that their contributions are valued.
Incentives can take various forms, such as monetary rewards, gift cards, or tangible items. Also, consider low-cost or free options that are specific to your organization.
If you want to protect the identity of survey respondents and keep your survey anonymous, consider asking survey respondents to submit a screenshot of the final page of their survey to be eligible for any incentives you might offer.
3. Get the word out
You’ll want to use multiple communication channels to promote your survey. Use those that the young people and parents in your organization access the most. Some of the more common channels include:
Email the survey link directly to the young people in your community. You may choose to build awareness through an existing series of emails, but emails designated specifically for promoting the survey tend to garner more attention. Clearly stating the purpose of the survey, sharing any incentives you are offering, and indicating the survey deadline can increase the likelihood of recipients clicking on the link.
Parent Contact
One of the best ways to ensure that the young people in your community take the survey is to supply parents with the survey information and link. Use your preferred channels in communicating with parents to distribute this information, especially for young people under 18.
Announcements
Face-to-face interactions are ideal for building survey awareness. Allow key leaders to make announcements at services, group meetings, daily touchpoints, etc.
Text Messages (SMS)
Sending the survey link via text messages to individuals who have opted in to receive communications from your organization can be an effective method, especially for reaching young people. Text messages should be clear and concise, and they should include a direct link to the survey.
Printed Materials
Consider printing the survey link on bulletins, flyers, posters, brochures, newsletters, or event programs. The QR code can make it easy for individuals to access the survey link using their mobile devices.
Because you only want young people to take the survey, make sure all materials specify the survey’s target audience.
Social Media
Many organizations have social media platforms, such as Facebook, Twitter, LinkedIn, Instagram, and others. We discourage sharing the survey link via social media as a best practice, mainly to avoid bots and scammers. Fake responses will skew your results.
We do suggest using social media to announce and remind people that the survey is happening, telling followers to check their email or to watch for a text message with the survey link. There are no refunds if your survey results are filled with false data, so distribute the link only where real respondents will receive it and respond.
4. Continue to promote
It will take more than one announcement to get enough survey respondents. To maximize the number of young people who take your survey, communicate about it early, often, and through multiple channels. A good rule of thumb is to send a minimum of three types of messages: an introductory communication before the survey period begins, reminders throughout the survey period, and a final push right before the survey period ends.
Here are some additional survey distribution tips:
- Use the channels that young people use. The young people in your organization may receive general communications meant for the masses, but they probably pay closer attention to communications sent through specific channels or by specific people. Tap into those networks to send reminders periodically during the survey period.
- Don’t underestimate the power of a personal invitation. While a mass invitation can work, personal invitations to participate generate a greater inclination to do so—especially if the person asking is a trusted adult. Lean on leadership, staff, parents, and other trusted adults to ask young people directly to take the survey. Peers make great ambassadors as well; consider designating a few young leaders to spread the word.
- Remind, remind, remind. Throughout the open period, activate official channels and relational networks to remind young people to take the survey. Daily reminders are not necessary, but multiple reminders are helpful.
- Tell young respondents that their voices matter. Young people are the next generation of your organization! When young people feel like their contributions matter and are important for what’s to come, they are more likely to participate.
- Show gratitude. Take every opportunity to thank those who take the survey as well as those who help spread the word about it. Seeing the community express genuine gratitude for the effort builds trust and credibility, which generates greater participation.
5. Close (or extend) the survey
Before you close the survey, be sure you have enough responses. The relevance and reliability of your data depend on your sample size. A smaller sample size may reflect attitudes and experiences that aren’t representative of the young people in your community. For accurate research, more data is better! If your population of young people is small, it is even more important that everyone takes the survey. Ten percent of a group of ten will not provide enough respondents. If you don’t have enough responses, reconsider your survey timing and communication plan, and take another try at recruitment.
Once you’ve conducted and closed your survey, it’s time to analyze your data.
How to Interpret Your Survey Results
1. Read the data
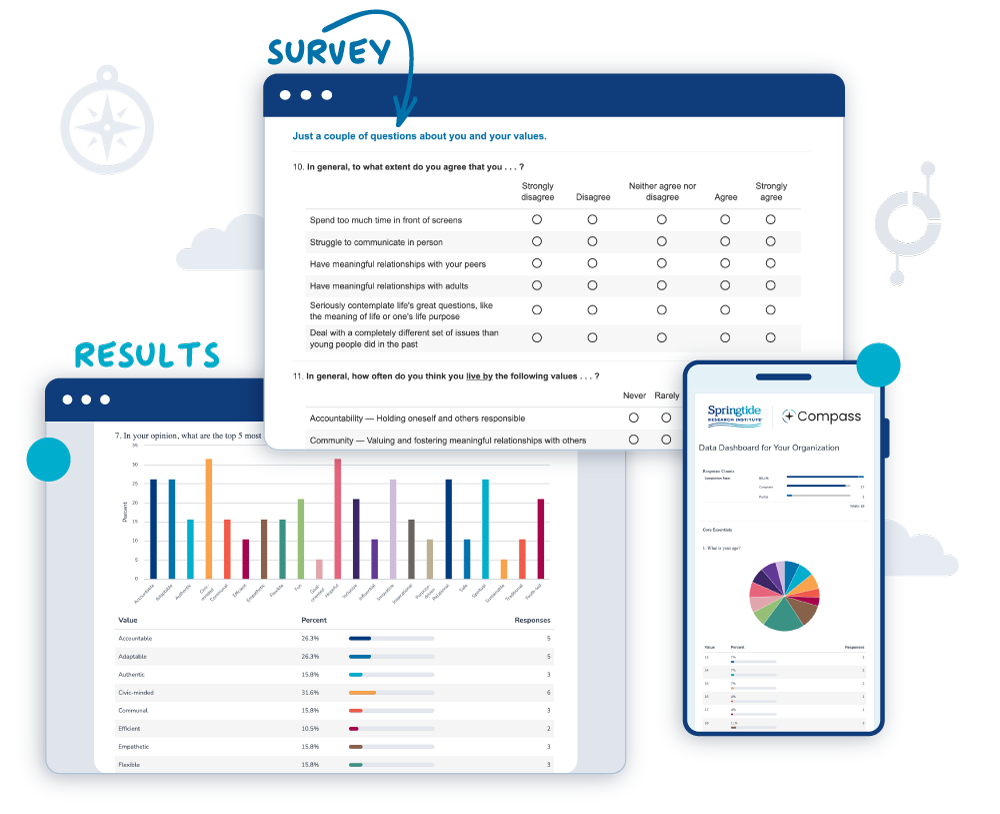
Different survey platforms will display data differently. Some platforms may simply give you the list of responses, while others (like Compass from Springtide) may generate bar graphs and pie charts.
If you have access to the data in a list, you can use a tool like Microsoft Excel or PowerPoint to model and view your data. A personalized survey platform like Compass will provide you with a full dashboard and ready-made charts automatically. Compass is designed for fast administration and analysis, so you can spend less time stuck in spreadsheets and more time with the young people you serve.
Study the type of graph or table you’re dealing with. Is it a bar graph, a line graph, a pie chart, or something else? Each type of graph/table presents data differently. Pay attention to any labels on the horizontal or vertical axes; they tell you what the graph is measuring.
Next, look at the data points or bars on the graph – what do they represent? Are there any patterns or trends?
2. Reflect on the data
Data enhances decision-making and future planning. At the same time, it is important to remember that all surveys have limitations. Keep the following in mind:
Approach any “negative” scores with curiosity rather than defensiveness. Explore what can be adjusted to improve outcomes. Collecting data is an important step in building a culture that fully engages young people.
Surveys won’t capture nonquantifiable aspects, such as stories and emotions or motivations. When interpreting data, consider factors that might speak to the emotions or motivations behind a response. These could include changes in leadership, events within the organization that impact the culture of the organization, personal interactions with the organization or the people within it—any of which might influence a young person’s opinion or impressions of the organization.
3. Discuss the data.
Once you have your data in hand, we recommend convening a “town hall” of sorts to share and talk through what you’ve learned. Ask the young people in your community what surprises them and what resonates with their own experiences. Invite their stories! Encourage leaders of all ages to share where they see opportunities to grow and adapt to better welcome and engage young people. Convene a working group to move the data into the next steps of mission-aligned implementation.
Everything you need to conduct your own survey. None of the headache.
Compass is the ready-made toolkit that takes Springtide’s nationally tested surveys and brings them to your organization.
Ready to purchase? Call 866-457-7927.