The Compass Road Map below provides a thorough overview of tips and tricks for a smooth survey process. You know your community and young people. Use that knowledge and those instincts to customize your journey!
This Road Map expands on the three steps from the Quick Start Guide: Preparation, Distribution and Interpretation.
Preparation
1. Choose when to survey.
Survey during the time of year or season when most of the young people in your organization are present and active. This offers the best chance of getting as many young people as possible to take your survey.
Young people’s schedules tend to operate in cycles. Although it might seem like their schedules are packed during these key times, higher engagement with your organization offers more touchpoints to build awareness and allow young people to take the survey.
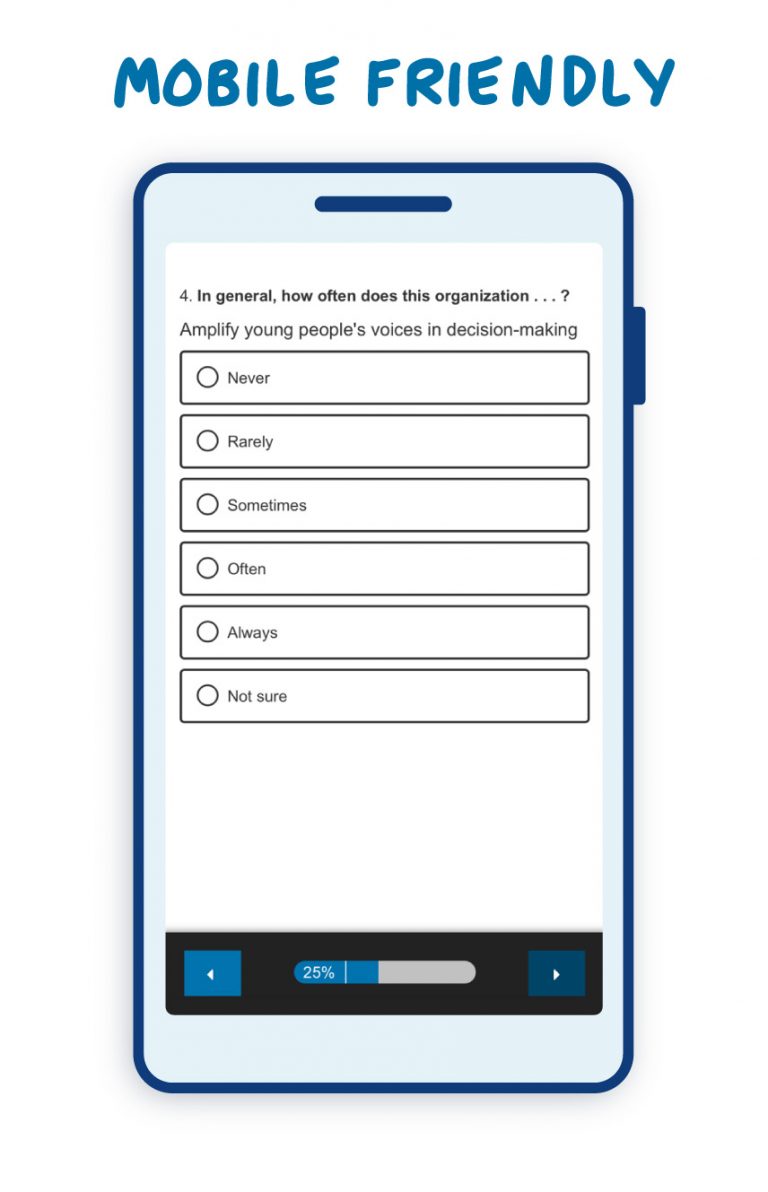
The core Compass survey takes about 8 minutes to complete, and each add-on survey module takes between 4 and 5 minutes. Respondents can open the survey on any internet browser, so it will work on mobile devices!
2. Determine the length of your survey period.
We often see the best results with a focused two-week push or a month-long campaign. You know your community best, so plan a time frame that will maximize participation.
While technically you have a year to distribute your survey, you won’t want to wait that long. Acting with a sense of urgency helps you get insights about the young people in your community quickly so that you can make data-driven decisions sooner rather than later.
3. Offer incentives.
Participation incentives, or rewards, are small tokens of appreciation designed to motivate young people to complete the survey. Incentives lead to higher response rates, improve the quality of the data collected, and enhance overall participant engagement. Incentives acknowledge and appreciate the respondents’ time and effort, signaling that their contributions are valued.
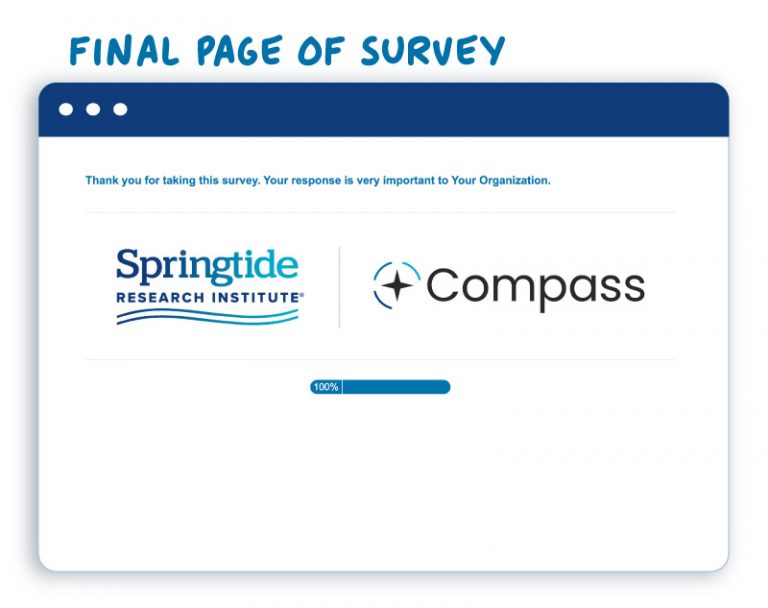
Incentives can take various forms, such as monetary rewards, gift cards, or tangible items. Also consider low-cost or free options that are specific to your organization, such as a reserved parking spot for a week or a special lunch. Because we protect the identity of survey respondents, there is no automatic way to know who took the survey, so consider asking survey respondents to submit a screenshot of the final page of their survey to be eligible for any incentives you might offer.

Distribution
1. Introduce the survey.
Explain to the young people and their parents what the survey is, who it is intended for, and what you plan to do with the insights you gain from it. Remember to make it clear that this is a survey just for the young people (ages 13 to 25) in your organization.
Universities or formal research organizations who issue surveys generally gain consent from each respondent or secure permission from a parent for a child under the age of 18 to participate. Compass comes preprogrammed with a brief consent statement at the start of the survey. If you are surveying young people under the age of 18, you should inform parents about the survey, its purpose, and the plan for using the data collected. If a parent does not want their child to participate, they must communicate that desire to their child.
When you promote the survey, people might ask, “Who is Springtide?” Here is a brief description you can use in distribution materials to describe the role of Springtide as the survey provider:
Springtide Research Institute® engages the power of social science to learn from and about young people ages 13 to 25. As a nonpartisan, nonprofit organization, Springtide delivers accessible research on the perspectives and experiences of the newest generations. Their empirical data amplify the voices of young people, inform those who know and serve them, and lead the way in showing what’s next. Springtide is proud to offer Compass surveys to empower communities seeking to learn more about the young people they serve and to make data-informed decisions.
2. Get the word out.
You’ll want to use multiple communication channels to promote your survey. Use those that the young people and parents in your organization access the most. Some of the more common channels include:
Email the survey link directly to the young people in your community. You may choose to build awareness through an existing series of emails, but emails designated specifically for promoting the survey tend to garner more attention. Clearly stating the purpose of the survey, sharing any incentives you are offering, and indicating the survey deadline can increase the likelihood of recipients clicking on the link.
SAMPLE EMAIL TEXT
At [Organization Name], we are committed to fostering a community where every voice is heard and where all have the opportunity to grow and flourish. As part of our ongoing efforts to better understand the needs, interests, and aspirations of the young people in our organization, we are inviting you to participate in a brief survey designed to gather your valuable feedback and insights.
This survey was designed by Springtide Research Institute®, a nonpartisan, nonprofit organization that engages the power of social science to learn from and about young people ages 13 to 25. Compass surveys help organizations better understand the young people they serve directly. You can read more about Springtide here.
This survey covers a range of topics, including experiences with our organization, mental health, belonging, and more. All responses are anonymous and will be used only to help us grow and evolve our organization to best support young people.
If you are between the ages of 13 and 25, simply click on the link provided below to take the survey. The voices of our young people matter. Together, we can make [Organization Name] even more vibrant and inclusive for all.
[survey link]Parent Contact
One of the best ways to ensure that the young people in your community take the survey is to supply parents with the survey information and link. Use your preferred channels in communicating with parents to distribute this information, especially for young people under 18.
Announcements
Face-to-face interactions are ideal for building survey awareness. Allow key leaders to make announcements at services, group meetings, daily touchpoints, etc.
Text Messages (SMS)
Sending the survey link via text messages to individuals who have opted in to receive communications from your organization can be an effective method, especially for reaching those ages 13 to 25. Text messages should be clear and concise, and they should include a direct link to the survey.

Printed Materials
Consider printing the survey link on bulletins, flyers, posters, brochures, newsletters, or event programs. The QR code can make it easy for individuals to access the survey link using their mobile devices. Because you only want young people ages 13 to 25 to take the survey, make sure all materials specify the survey’s target audience.
Social Media
Many organizations have social media platforms, such as Facebook, Twitter, LinkedIn, Instagram, and others. We discourage sharing the survey link via social media as a best practice, mainly to avoid bots and scammers. Fake responses will skew your results. We do suggest using social media to announce and remind people that the survey is happening, telling followers to check their email or to watch for a text message with the survey link. There are no refunds if your survey results are filled with false data, so distribute the link only where real respondents will receive it and respond.
3. Continue to promote.
It will take more than one announcement to get enough survey respondents. To maximize the number of young people who take your survey, communicate about it early, often, and through multiple channels. A good rule of thumb is to send a minimum of three types of messages: an introductory communication before the survey period begins, reminders throughout the survey period, and a final push right before the survey period ends.
Here are some additional tips:
- Use the channels that young people use. The young people in your organization may receive general communications meant for the masses, but they probably pay closer attention to communications sent through specific channels or by specific people. Tap into those networks to send reminders periodically during the survey period.
- Don’t underestimate the power of a personal invitation. While a mass invitation can work, personal invitations to participate generate a greater inclination to do so—especially if the person asking is a trusted adult. Lean on leadership, staff, parents, and other trusted adults to ask young people directly to take the survey. Peers make great ambassadors as well; consider designating a few young leaders to spread the word.
- Remind, remind, remind. Throughout the open period, activate official channels and relational networks to remind young people to take the survey. Daily reminders are not necessary, but multiple reminders are helpful.
- Tell young respondents that their voices matter. Young people are the next generation of your organization! When young people feel like their contributions matter and are important for what’s to come, they are more likely to participate.
- Show gratitude. Take every opportunity to thank those who take the survey as well as those who help spread the word about it. Seeing the community express genuine gratitude for the effort builds trust and credibility, which generates greater participation.
4. Check your progress.
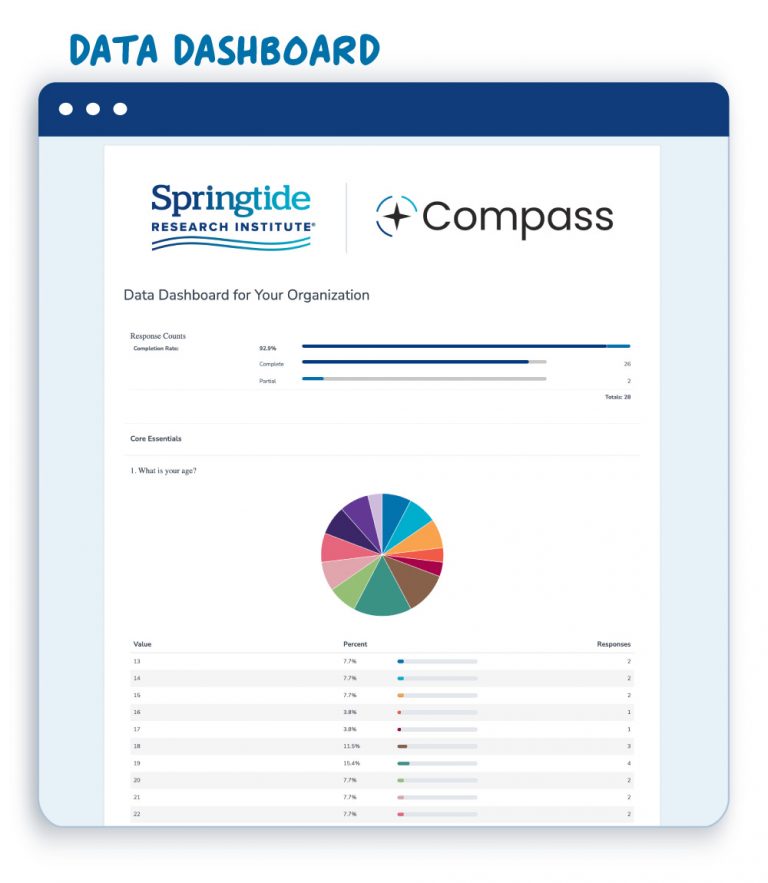
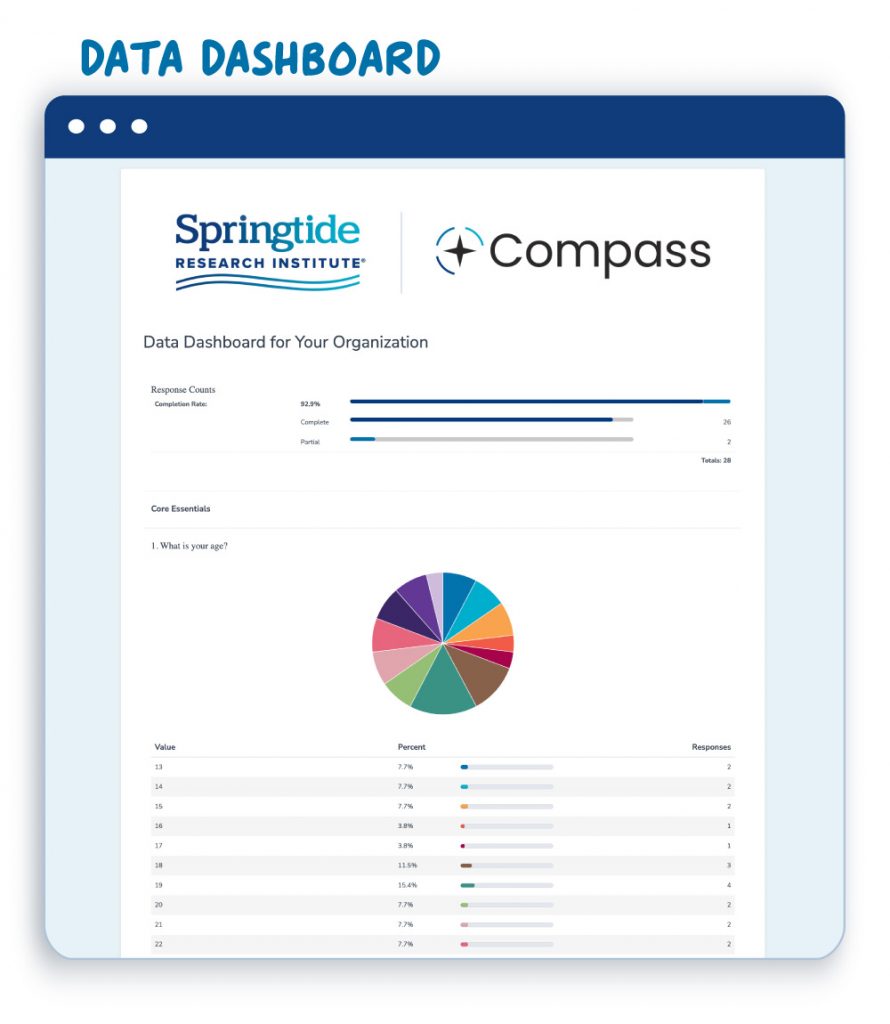
Your online data dashboard lets you see survey results as they come in. While this lets you keep tabs on your survey, the best practice is to check the results page for the number of respondents only and to delay looking at incoming data until the survey closes. An early peek might yield misleading conclusions based on incomplete data. If you are not getting enough responses, consider ways to shift your promotions. Usually, the more targeted and personal the messaging, the better the results.
5. Close (or extend) the survey.
Before you close the survey, be sure you have enough responses. The relevance and reliability of your data depend on your sample size. A smaller sample size may reflect attitudes and experiences that aren’t representative of the young people in your community. More is better! If your population of young people is small, it is even more important that everyone takes the survey. Ten percent of a group of ten will not provide enough respondents. If you don’t have enough responses, reconsider your survey timing and communication plan, and take another try at recruitment!
Interpretation
1. Read the data.
On your data dashboard, your results are presented in the aggregate, meaning that all individual survey responses are combined and shown together as a group. You have access to your dashboard for two years after the date of purchase. Print out your results so that you can refer to them as you work through the interpretation process. The data can be separated into subgroups (e.g., gender) by purchasing the Custom Analyses & Slide Deck add-on module.
Responses to some question formats are displayed in pie charts or bar charts with percentages listed underneath. Question formats that ask respondents to rate their agreement with certain statements are shown in grids that include the percentage of responses found in each category. The larger percentages on the grids are highlighted in shades of blue. The darker shades indicate that more people responded that way.
With the grid format, it can be tempting to collapse categories to make more definitive statements on what young people are thinking or feeling. Each category represents a distinct level of agreement or satisfaction, so collapsing categories can sometimes lead to inflated claims. If you do choose to do this, it is important to word the statement in such a way to show that the percentage contains more than one category (e.g., Sixty-seven percent of young people agree or strongly agree that “There is someone in my life who gets excited for me when good things happen in my life.”).
2. Reflect on the data.
Remember that even with ideal sample sizes, survey data offer one snapshot of what your population of young people is thinking and feeling. When using the data to inform your decision-making, consider other information as well, including prior survey efforts, anecdotes, values, norms, and unique circumstances of the organization. The reality is that growth opportunities exist in any organization. Results that may be perceived as negative aren’t necessarily a commentary on staff competence, programming value, or the real efforts each person puts into offering healthy experiences for young people. Approach any “negative” scores with curiosity rather than defensiveness. Explore what can be adjusted to improve outcomes. Collecting data is an important step in building a culture that fully engages young people.
Data enhances decision-making and future planning. At the same time, it is important to remember that all surveys have limitations. Keep the following in mind:
- Surveys won’t capture nonquantifiable aspects, such as emotions or motivations. When interpreting data, consider factors that might speak to the emotions or motivations behind a response. These could include changes in leadership, events within the organization that impact the culture of the organization, personal interactions with the organization or the people within it—any of which might influence a young person’s opinion or impressions of the organization.
- Sometimes survey respondents answer questions in a manner they believe agrees with what surveyors want to hear. This is especially true when a survey is not anonymous. Your Compass survey does not ask for any identifying information, reducing the pressure young people might feel to answer in certain ways.
3. Discuss the data.
Once you have your data in hand, we recommend convening a “town hall” of sorts to share and talk through what you’ve learned. Ask the young people in your community what surprises them and what resonates with their own experiences. Invite their stories! Encourage leaders of all ages to share where they see opportunities to grow and adapt to better welcome and engage young people. Convene a working group to move the data into the next steps of mission-aligned implementation.
Consider the Compass Custom Analyses & Slide Deck add-on module if you would like Springtide to put together a PowerPoint summarizing key findings to share with key stakeholders and decision-makers.
Compass surveys are intended to “localize” what Springtide has learned from young people nationwide. We recommend reviewing your data alongside national findings reported in our annual State of Religion and Young People reports, which contain corresponding themes (belonging, mental health, sacred spaces, and more).
The Springtide team is available to help you tell the story of your organization and compare your community to national trends. Bring us to your next workshop, training, board meeting, or conference (in person or virtually). Learn more about our speaking services here.
Need help with data interpretation and implementation? Call us directly at 866-457-7927 and ask about the Custom Analyses & Slide Deck add-on module.

